YOLO Algorithm
Original Source: https://www.coursera.org/specializations/deep-learning
Basics of YOLO Algorithm
https://arxiv.org/abs/1506.02640
You only look once (YOLO) is a state-of-the-art, real-time object detection system.
Basically, we divide the input image to subsets and use object localization for each of the subset to localize and classify multiple objects in one input.
Say we want to detect pedestrians, cars, and motorcycles from an image. This is how we do it with YOLO algorithm.
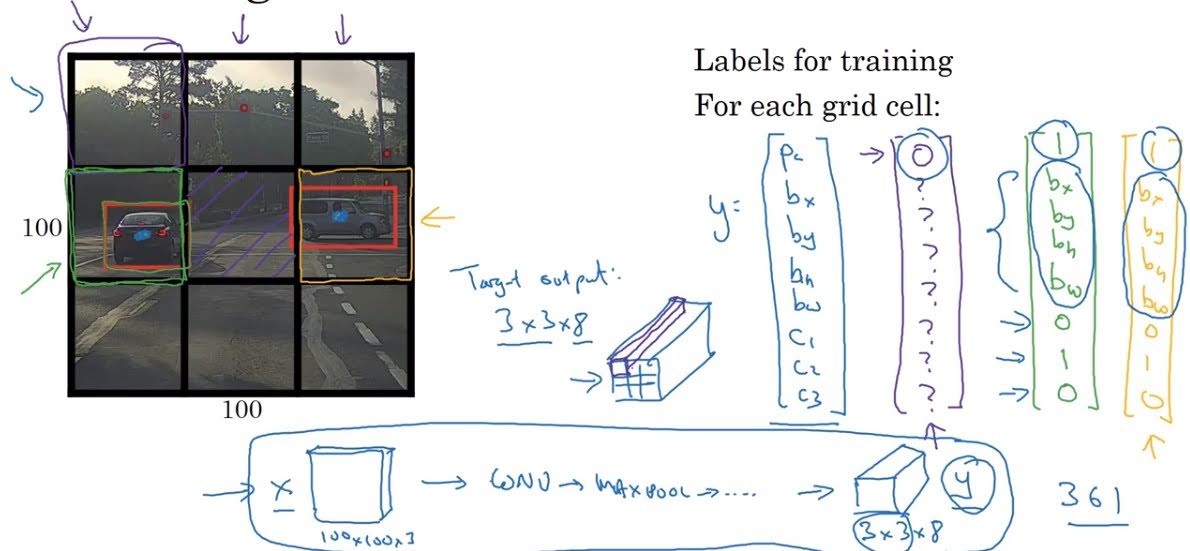
First, we divide the input image to 3x3 grid (in practice, we use finer grid like 19x19).
Label of an image would be of shape 3x3x8 since each grid cell will be a vector of $[p_c, b_x, b_y, b_h, b_w, c_1, c_2, c_3]$, where
- $p_c$: probability that the object is in that grid cell.
- $b_x, b_y$: x,y location of the center of the object. (top-left corner is (0,0) and bottom-right corner is (1,1))
- $b_h, b_w$: relative height and width of the object compared to grid cell width.
- $c_k$: probability that the object belongs to class $k$.
If the center of the detected car is in the middle-left grid like in the example above, middle-left vector of the label would be like this; $[1, 0.6, 0.5, 0.7, 0.6, 0, 1, 0]$.
$p_c$ of the top-right part will be 0, since there is no obect there.
$b_x, b_y$ which represents the center of the object should be a value between 0 and 1, but $b_h, b_w$ can be bigger than 1, since the object can pass over the grid boundary.
Shape of our predicted output would be same as the shape of label, which is 3x3x8.
Intersection Over Union (IoU)
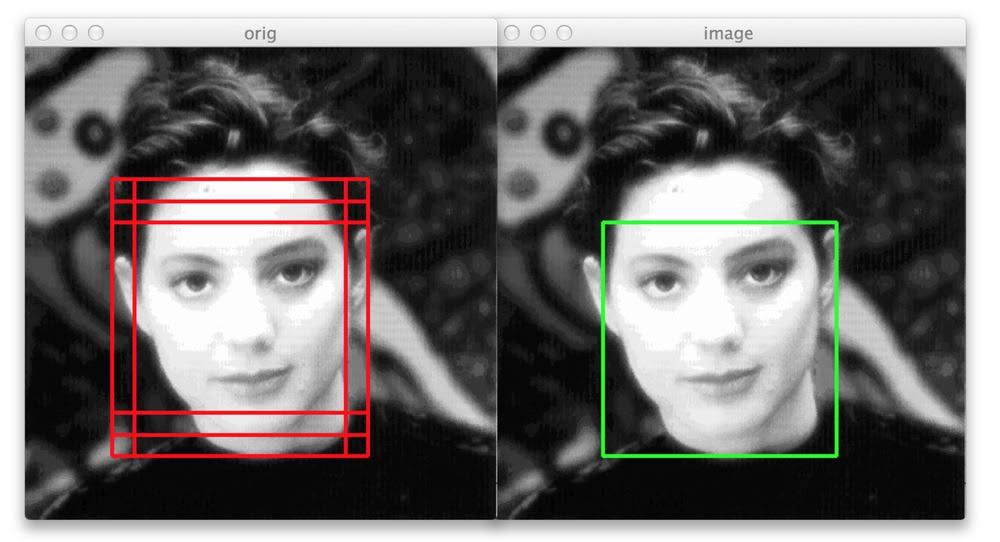
IoU is a measure of the overlap between two bounding boxes.
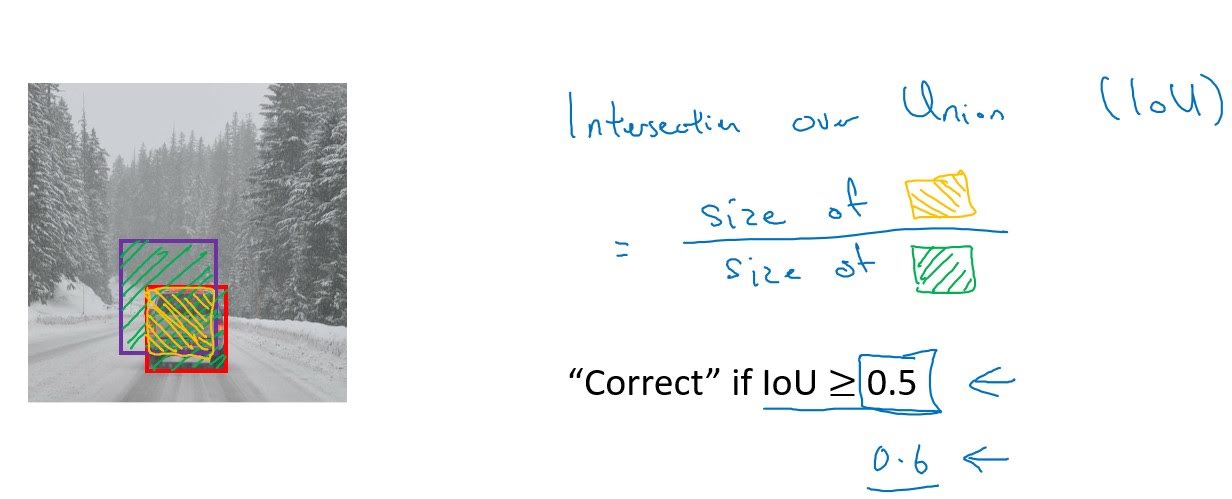
In the above example, red box is label and purple box is prediction. IoU equals size of yellow box divided by size of green box. Here, we’ve set threshold to 0.5; consider it predicted correct if IoU is bigger than 0.5. We can make this threshold bigger if we want to be more precise.
Non-max Suppression
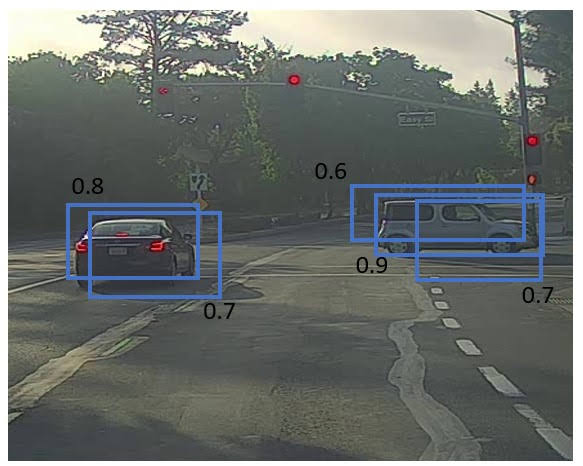
When grid is fine, multiple grids can predict that they’ve detected an object which is actually the same one, as shown above.
Non-max suppression is an algorithm to ensure that YOLO predicts one bounding box for each object in an image. The algorithm is as follows;
- Discard grid cells where $p_c<0.6$(you can change value 0.6).
- Pick the box with the largest $p_c$. Output that as a prediction.
- Discard any remaining box with IoU≥0.5 with the box output in step 2.
- Repeat step 2 and 3 until there is no remaining box to process.
If there are multiple classes, use $p_cc_k$ instead of $p_c$ and do above steps for each class.
Anchor Box
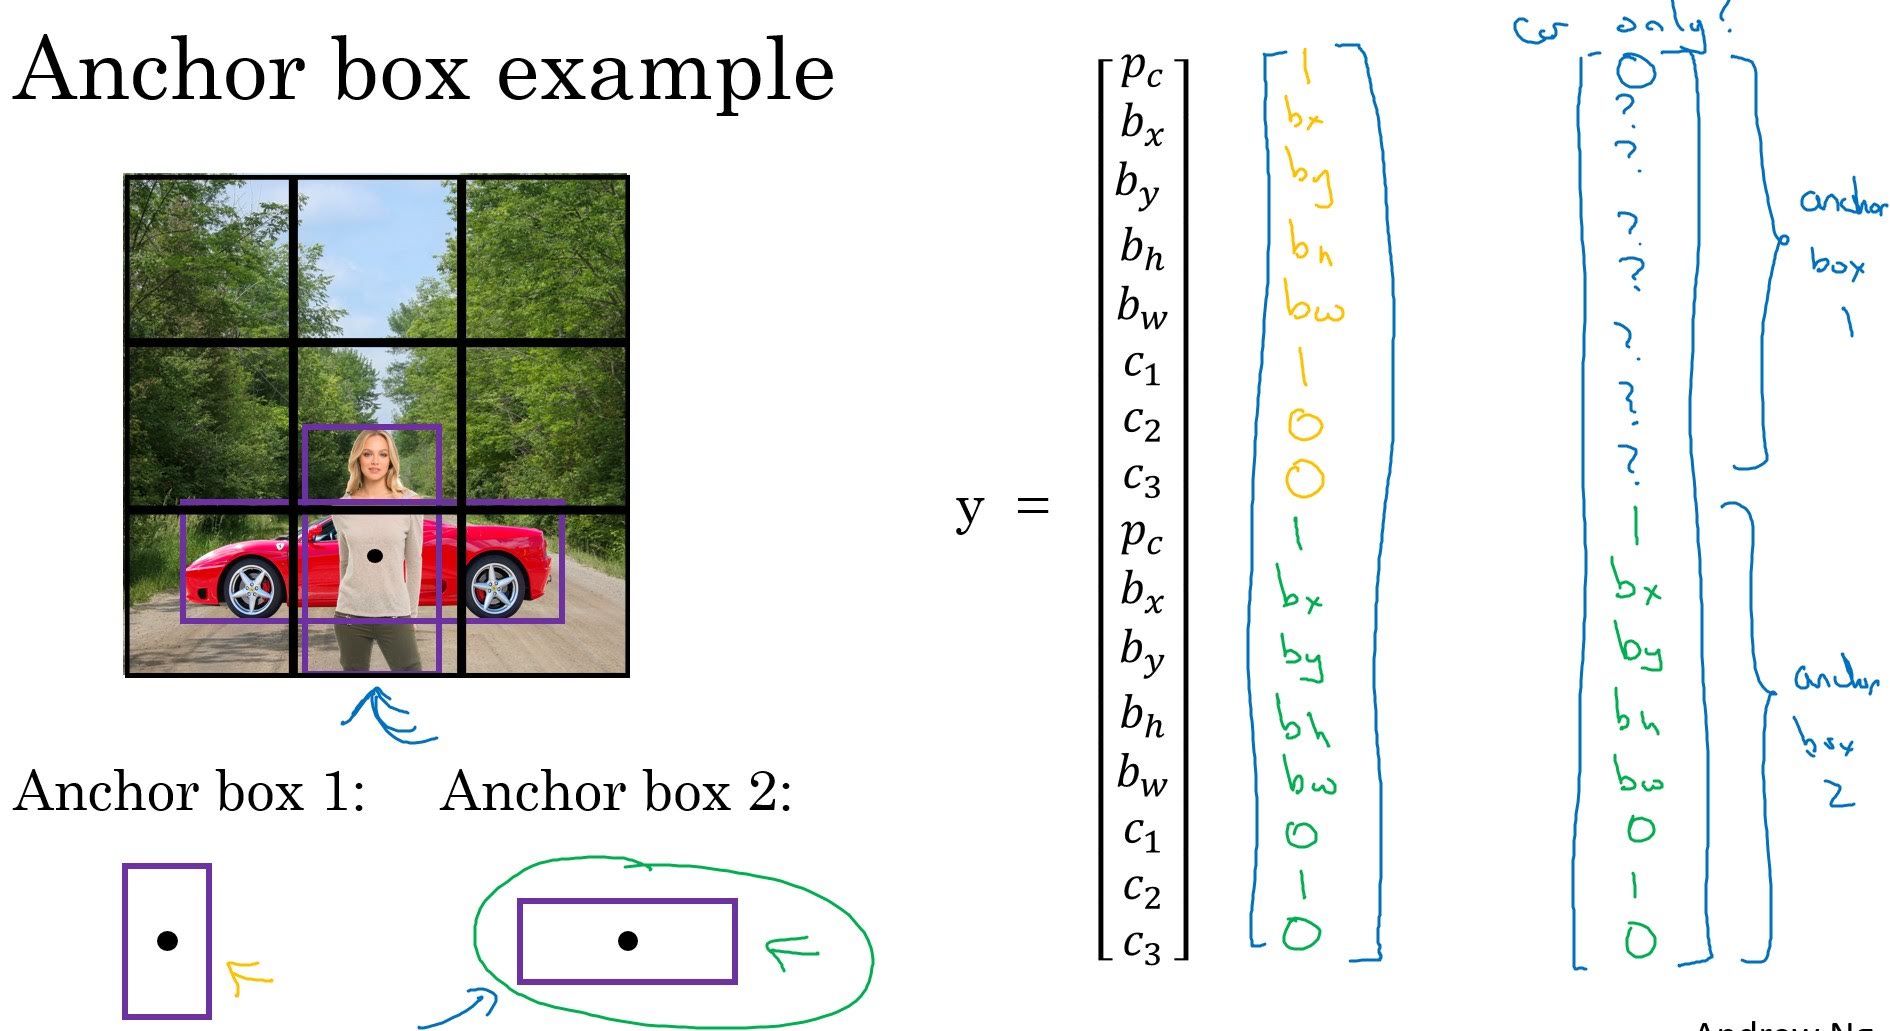
There can be two objects that should be assigned to a single grid cell, like in the image above. In this case how do we label the image?
We can use ‘anchor boxes’.
Let’s say we want to detect cars, pedestrains and motorcycles in an image. In the above example, there are woman and car that we should assign to the bottom-middle grid cell. Make two anchor boxes; tall one and wide one. Then our label should have 16(8x2) elements. First 8 elements for informations about object detected in that cell similar to anchor box 1, and the other 8 elements for informations about object similar to anchor box 2(‘Similar’ means having high IoU). It means that we are assigning car to wide anchor box and woman to tall anchor box, and labeling bottom-middle grid cell $[1, b_{x1}, b_{y1}, b_{h1}, b_{w1}, 1, 0, 0, 1, b_{x2}, b_{y2}, b_{h1}, b_{h2}, 0, 1, 0]$(whatever values $b$s are).
Anchor boxes can be choosed manually or with the K-means algorithm.
Summarization
Assume you want to detect pedestrains, cars, and motorcycles from an image with 19x19 grid. Also say you decided to use 2 anchor boxes; tall one and wide one.
Our target vector of each grid cell would be composed of 16 values. ($[p_{c1}, b_{x1}, b_{y1}, b_{h1}, b_{w1}, c_{11}, c_{21}, c_{31}, p_{c2}, b_{x2}, b_{y2}, b_{h1}, b_{h2}, c_{12}, c_{22}, c_{32}]$)
- Label training data. (shape: 19x19x16)
- Train CNN with input and label. (shape: same as label)
- For each grid cell, get predicted bounding boxes for each anchor box.
- Get rid of low probability predictions. (e.g. where $p_cp_k<0.5$)
- For each class (pedestrian, car, motorcycle), use non-max suppression to generate final predictions.

Leave a Comment