
Dimensionality Reduction and Principle Component Analysis (PCA)
Purpose of Dimensionality Reduction
1. Data Compression
We may want to reduce the dimension of our features if we have a lot of redundant data.
To do this, we find two highly correlated features, plot them, and make a new line that seems to describe both features accurately. We place all the new features on this single line.
Doing dimensionality reduction will reduce the total data we have to store in computer memory and will speed up our learning algorithm.
2. Visualization
It is not easy to visualize data that is more than three dimensions. We can reduce the dimensions of our data to 3 or less in order to plot it.
We need to find new features, $z_1$, $z_2$(and perhaps $z_3$) that can effectively summarize all the other features.
Example: hundreds of features related to a country’s economic system may all be combined into one feature that you call “Economic Activity.”
Example
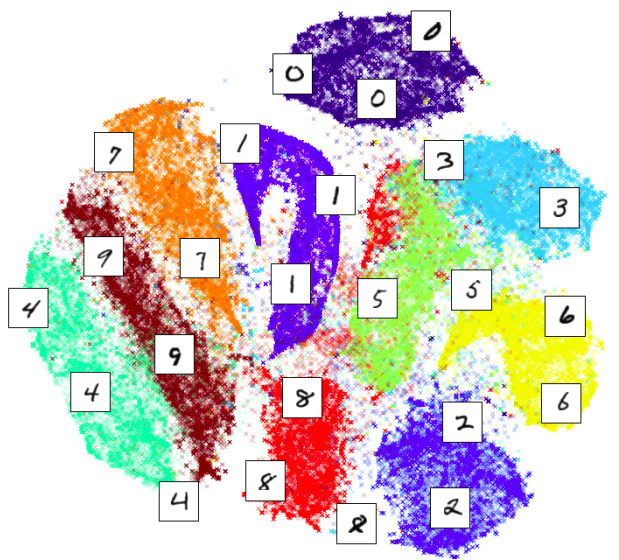
Below is the mnist dataset represented in 2d plane by ‘t-sne’ algorithm.
Principal Component Analysis (PCA)
The most popular dimensionality reduction algorithm is Principal Component Analysis (PCA).
The goal of PCA is to reduce the projection error. Projection error is the average of all the distances of every feature to the projection line.
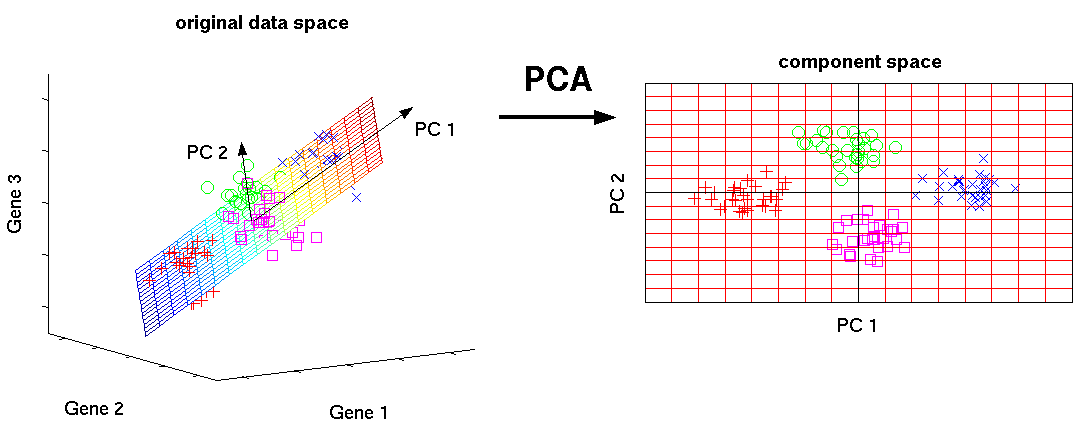
Specifically PCA can be thought of as fitting an k-dimensional ellipsoid to the data, where each axis of the ellipsoid represents a principal component.
Below is the image of PCA finding a 2-dimensional ellipsoid in 3-dimensional space that minimizes projection error.
Evaluating PCA
How do we evaluate how well PCA represented the original data?
We divide ‘average squared projection error’ by ‘total variance in the data’ and use this value to evaluate ‘retained variance(RV)’.
\[RV = \dfrac{\sum^m_{i=1}||x^{(i)} - x_{approx}^{(i)}||^2}{\sum^m_{i=1}||x^{(i)}||^2}\]If RV equals 0.01, we say that 99% of the variance was retained after PCA.


Leave a Comment